
Venturz Analytics helps you track everything in one place—your website traffic, campaign performance, and sales metrics. You can see how people interact with your pages, emails, and product.
With Venturz Analytics, you can easily monitor how visitors interact with your website. This helps you understand user behavior, see what’s working, and make better decisions to improve your content or pages.
Venturz automatically tracks key metrics, including:
- Page Views
- Total Clicks
- Time Spent per User
These insights give you a quick snapshot of how your website is performing.
At the top of the Analytics dashboard, you’ll see a quick summary of your performance over the last 6 days. This section gives you a clear snapshot of how your platform is growing.
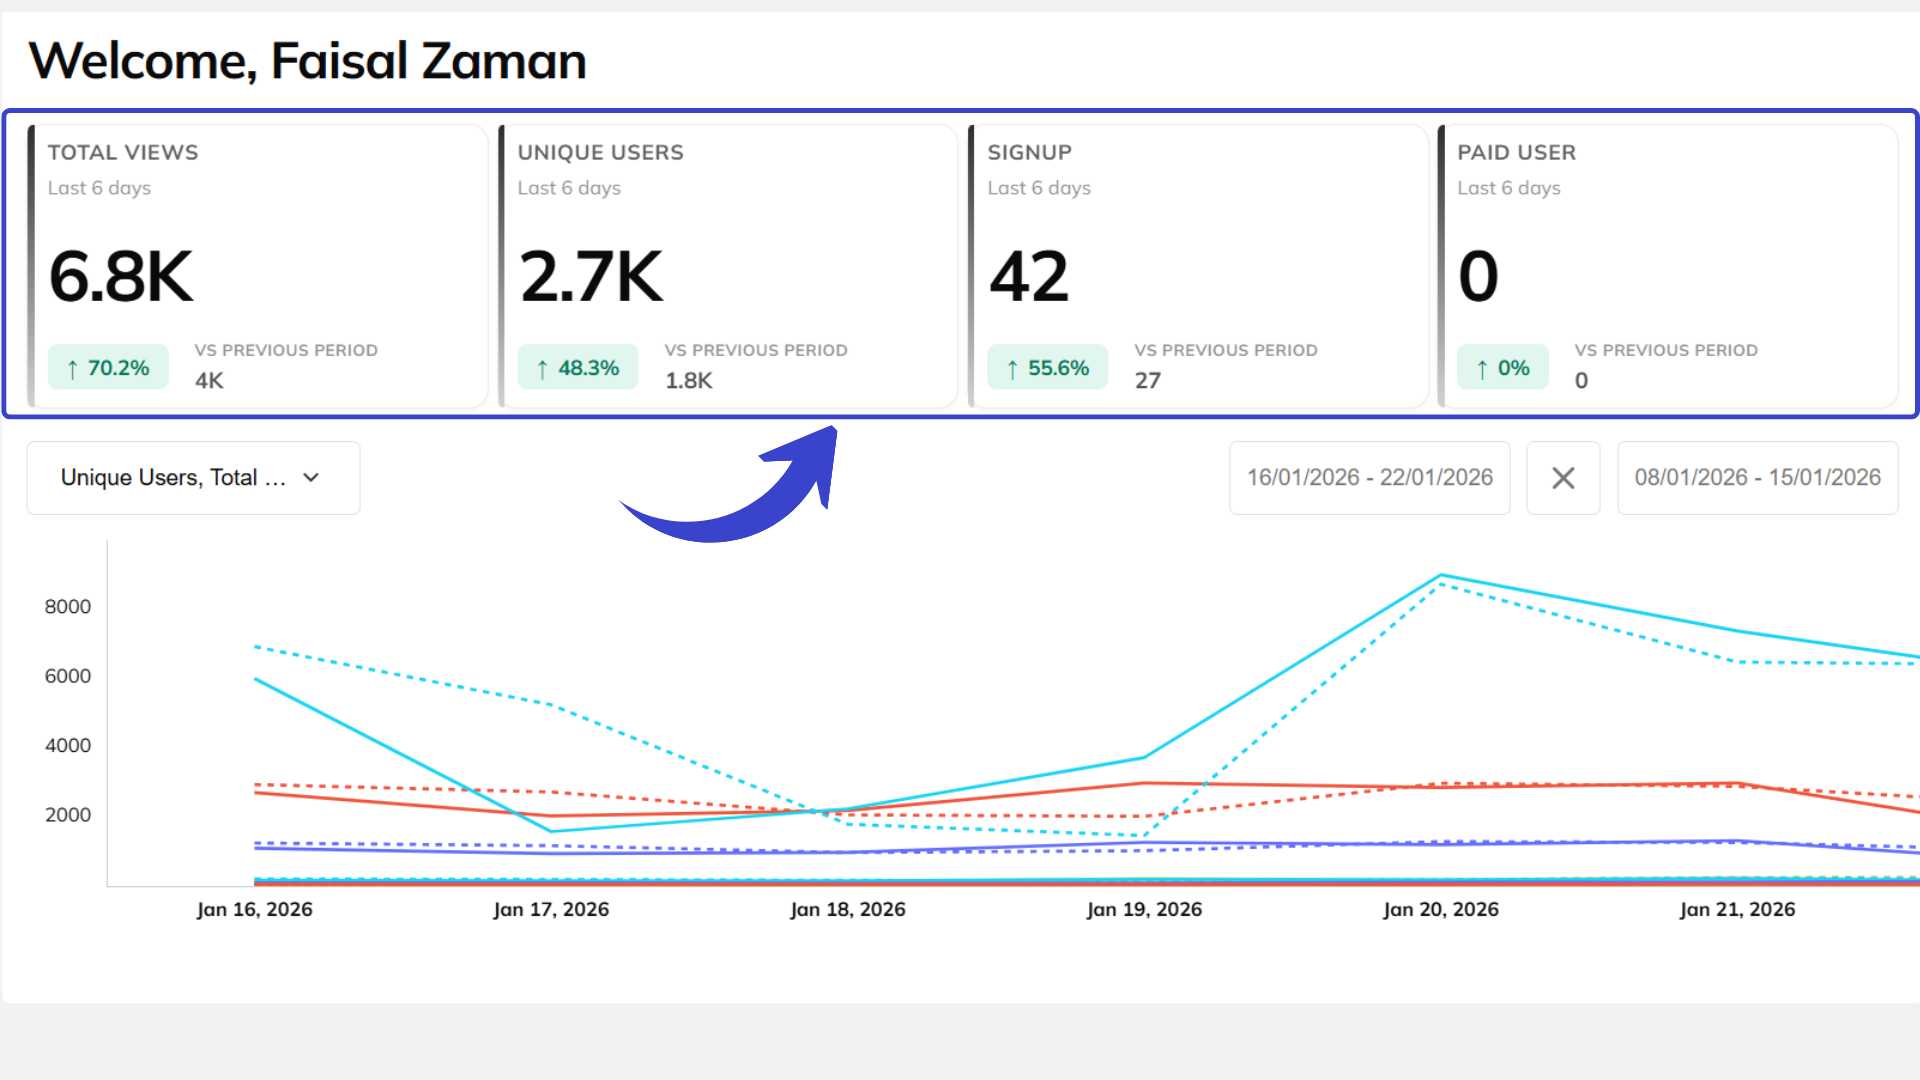
Each card highlights a key metric:
Total Views
Shows the total number of times your pages or content were viewed.
You can also see the percentage increase compared to the previous period, along with the earlier value for quick comparison.
Unique Users
Displays how many individual users visited your platform.
This helps you understand how many real people are engaging, not just repeat visits.
Signup
Indicates how many new users registered during this period.
This is useful for tracking how well your platform is converting visitors into users.
Paid Users
Shows how many users upgraded to a paid plan.
This gives a direct view of revenue-related growth and conversion performance.
Each metric includes:
- A percentage change (increase or decrease)
- A comparison with the previous period
This section helps you quickly understand trends without needing to dig into detailed reports.
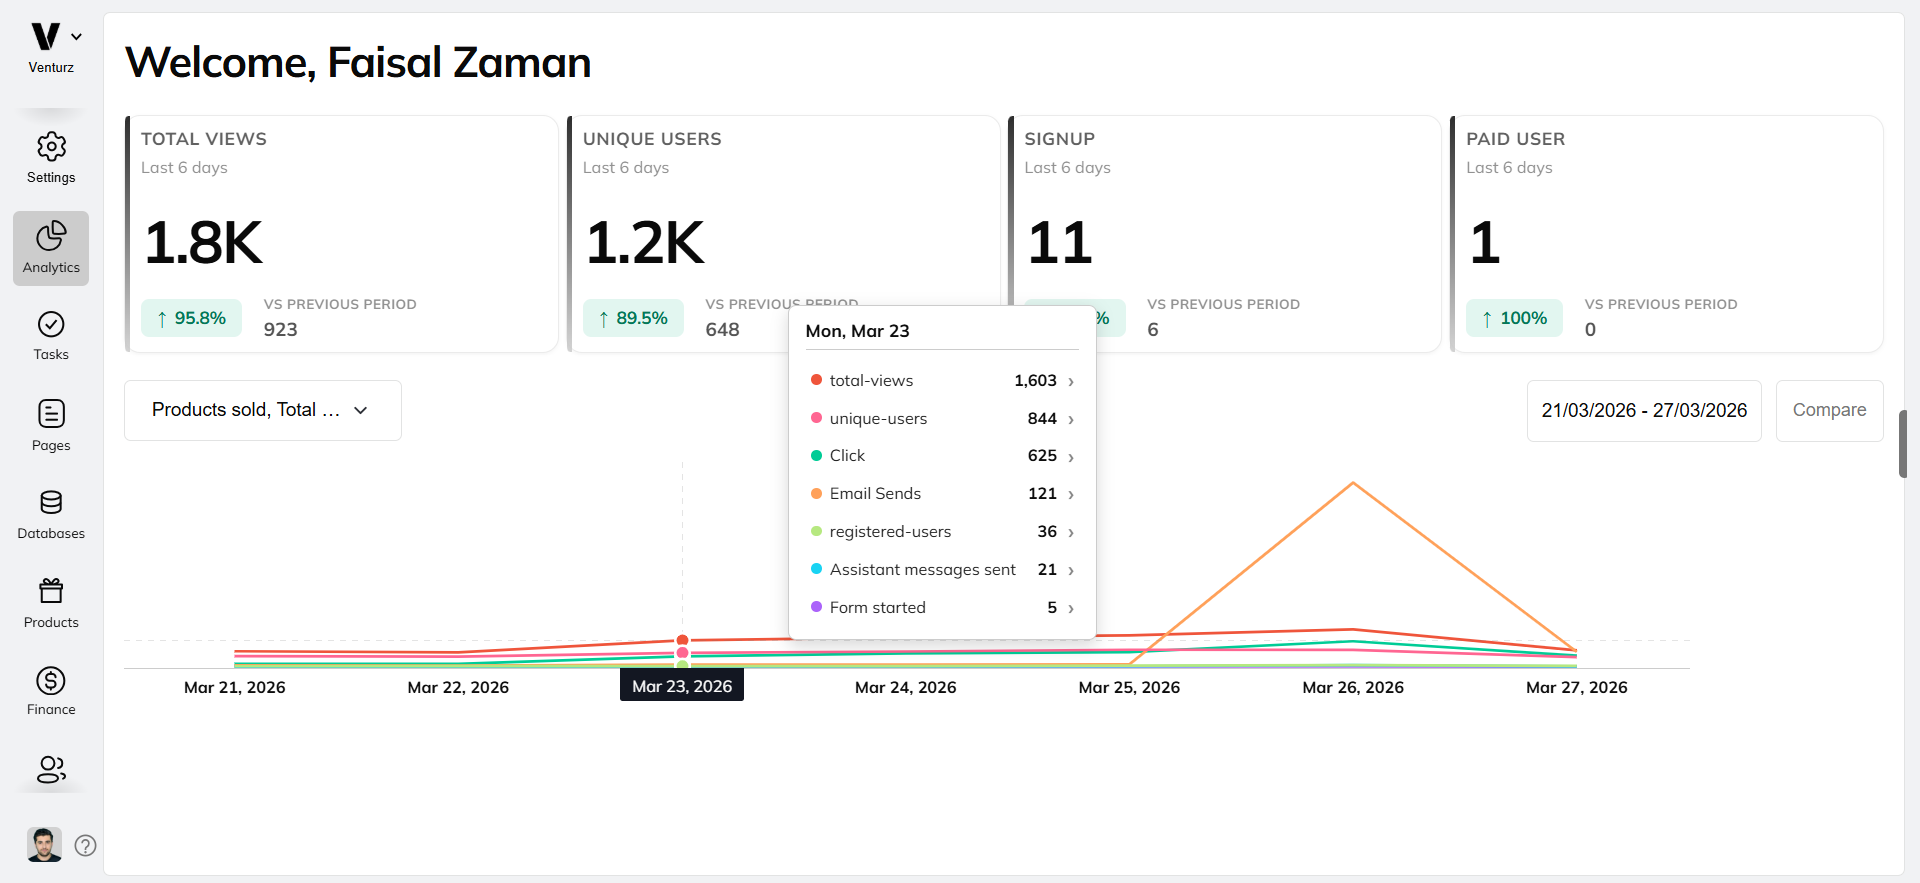
The analytics graph below the summary cards helps you understand how users interact with your website on a daily basis.
You can track how many people visited your site, how many views were generated, and how user activity changes over time.
When you hover over any point on the graph, you’ll see detailed data for that specific day. This includes:
- Total number of views
- Number of unique users
- Exact date for the activity
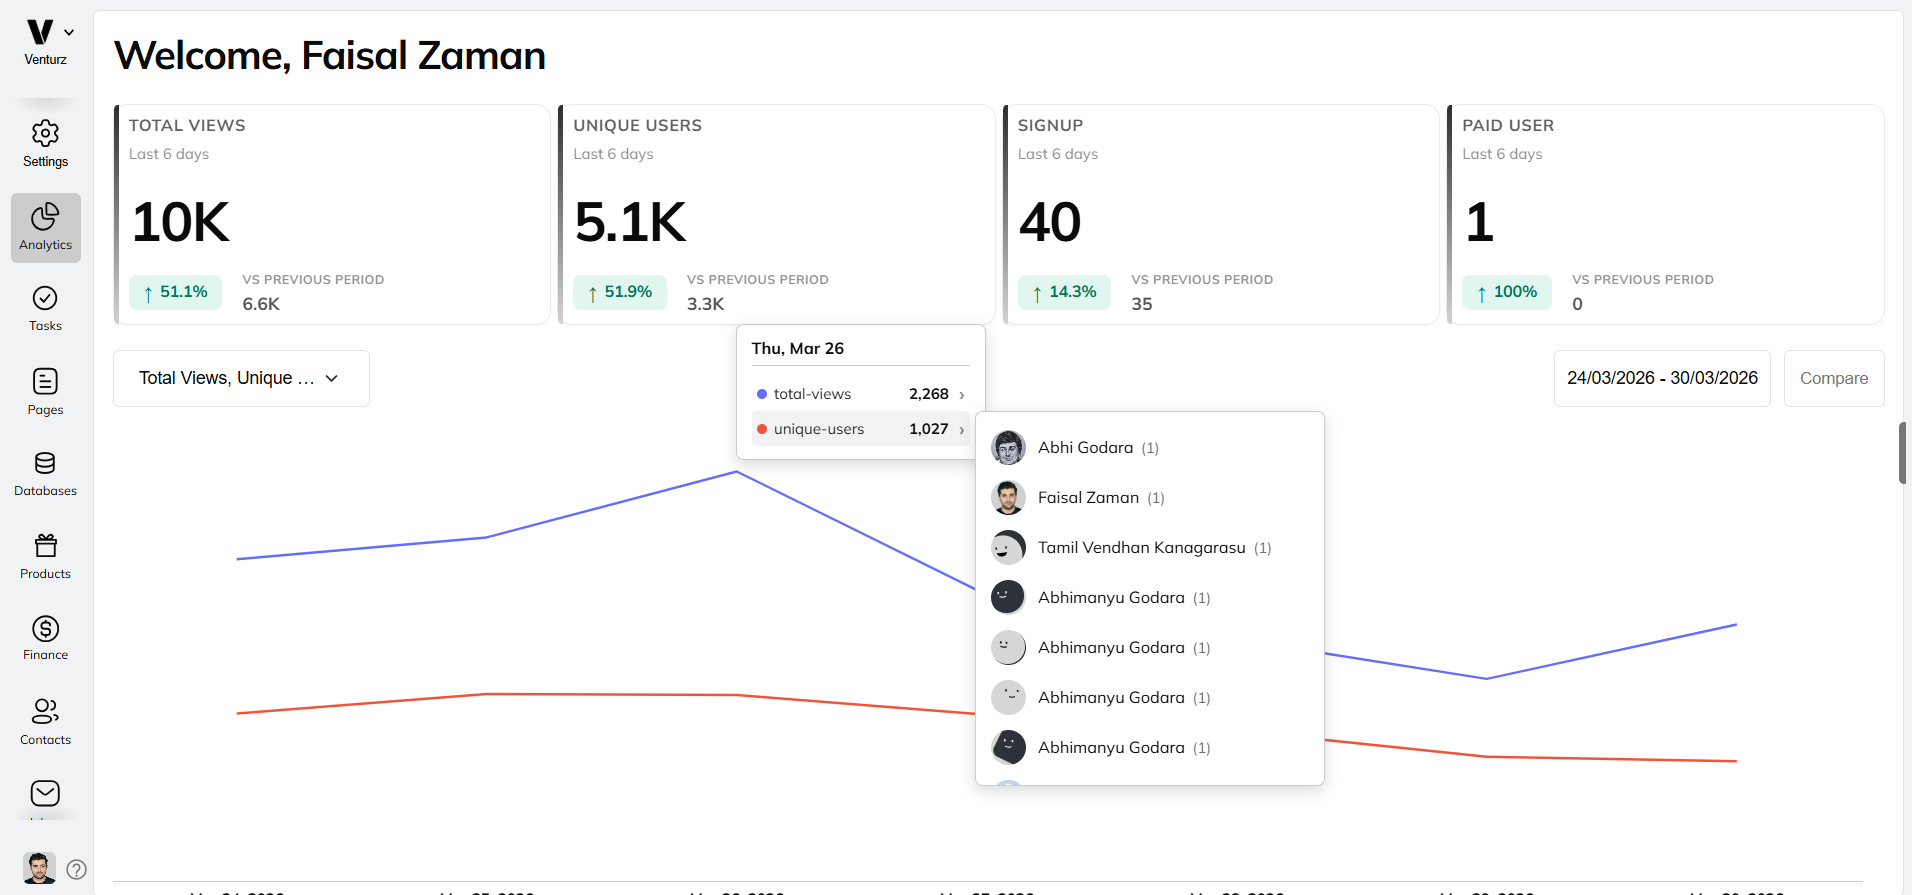
In some cases, you can also see which users were active on that day. This allows you to understand who interacted with your website and how often they engaged.
You can use the dropdown above the graph to switch between different metrics, and apply filters to break down the data further, such as by country, device type, or user type.
This section helps you monitor daily performance, understand user behavior, and make better decisions based on real usage data.
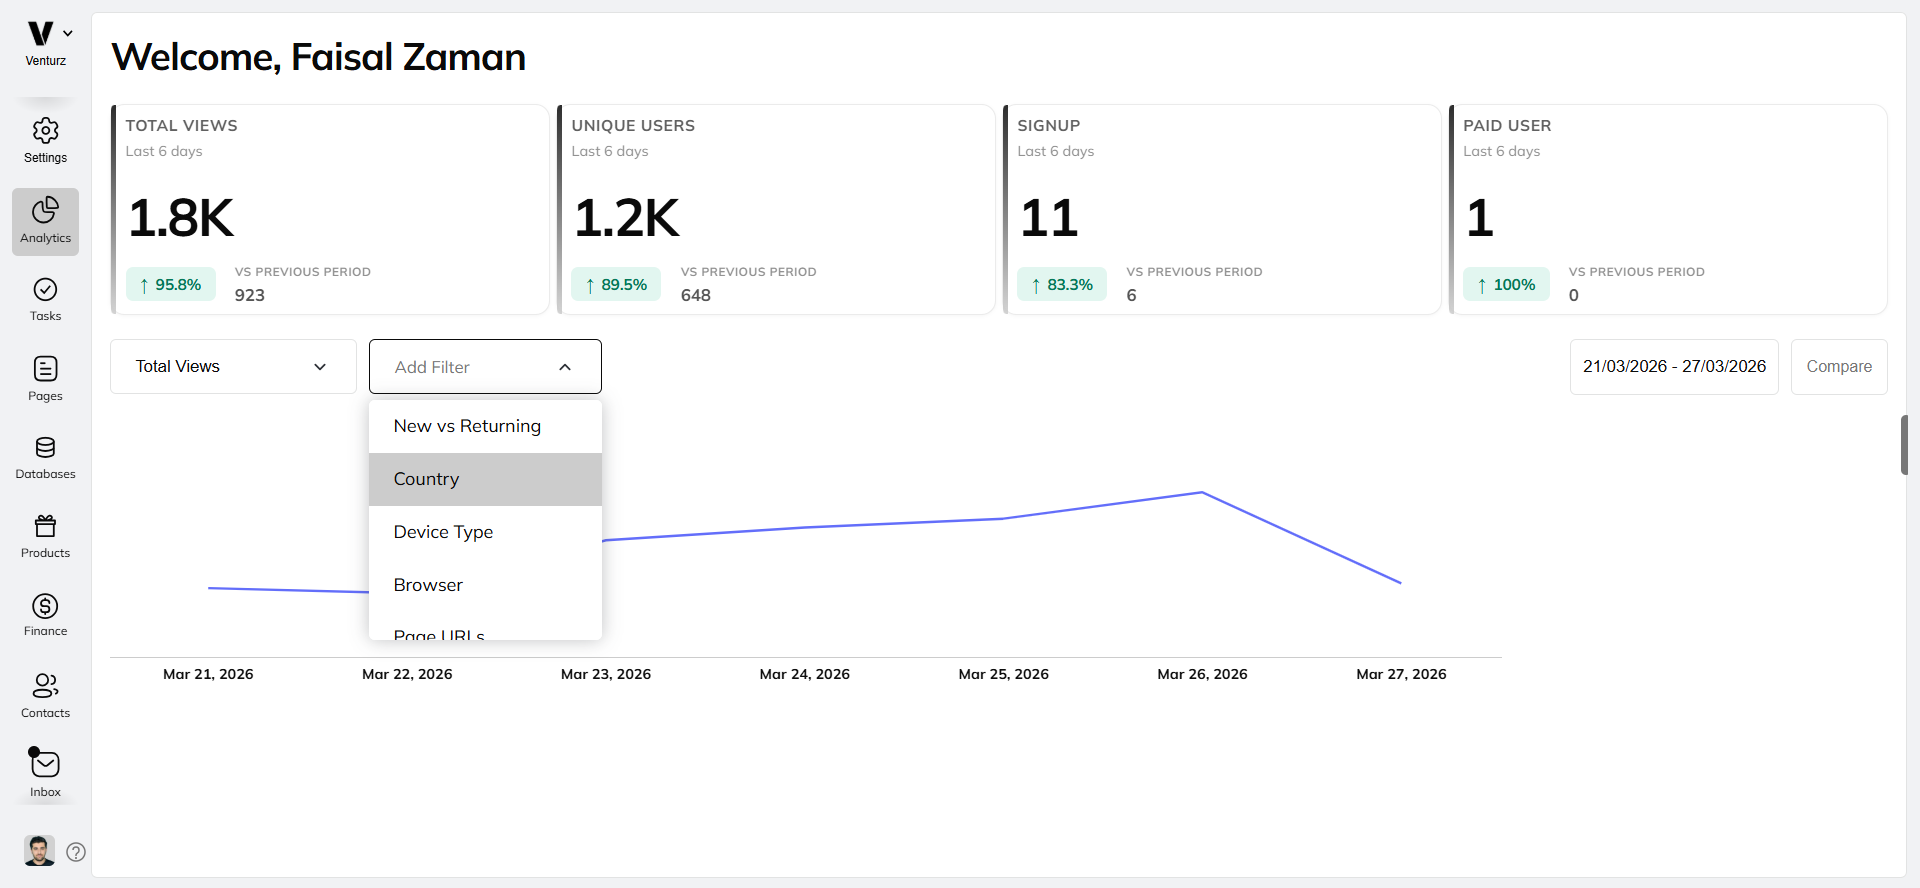
To get more detailed insights, you can apply filters. These help you break down the data and understand your audience better.
You can filter analytics by:
- Country – See where your visitors are coming from
- Device Type – Desktop, mobile, or tablet
- Browser – Understand which browsers your users prefer
- Page URLs – Focus on specific pages on your website
- UTM Source – Track traffic sources like email, ads, or social media
- Referrer – View the last page a user came from before landing on your site
- Referrer Domain – Group referrals by domain (e.g., facebook.com, google.com)
Using filters makes it easy to compare performance across different user groups or traffic channels.
With Venturz, you can easily track the performance of your email and campaign messages. This helps you understand how your audience is engaging with your content and where improvements can be made.
Venturz gives you a clear view of your email and message performance, including:
- Messages Sent
- Email Bounces
- Email Opens and Clicks
To narrow down your campaign data, you can apply filters. These help you analyze how different audiences respond to your emails.
Available filters include:
- Country – Check how emails performed across different locations
- Device Type – See if users opened your emails on mobile, desktop, or tablet
- Browser – Understand which browsers your audience uses
- UTM Source – Monitor traffic sources like ads, social, or email campaigns
- Referrer – View the previous page users came from
- Referrer Domain – Group by referral websites (e.g., google.com, facebook.com)
- Host – Analyze performance across different hosting sources
- Origin – Check where the email was triggered from
- Subject – Filter by email subject lines
- Action – See which actions were triggered by the email
- Status – Track delivery, opens, and clicks (see below)
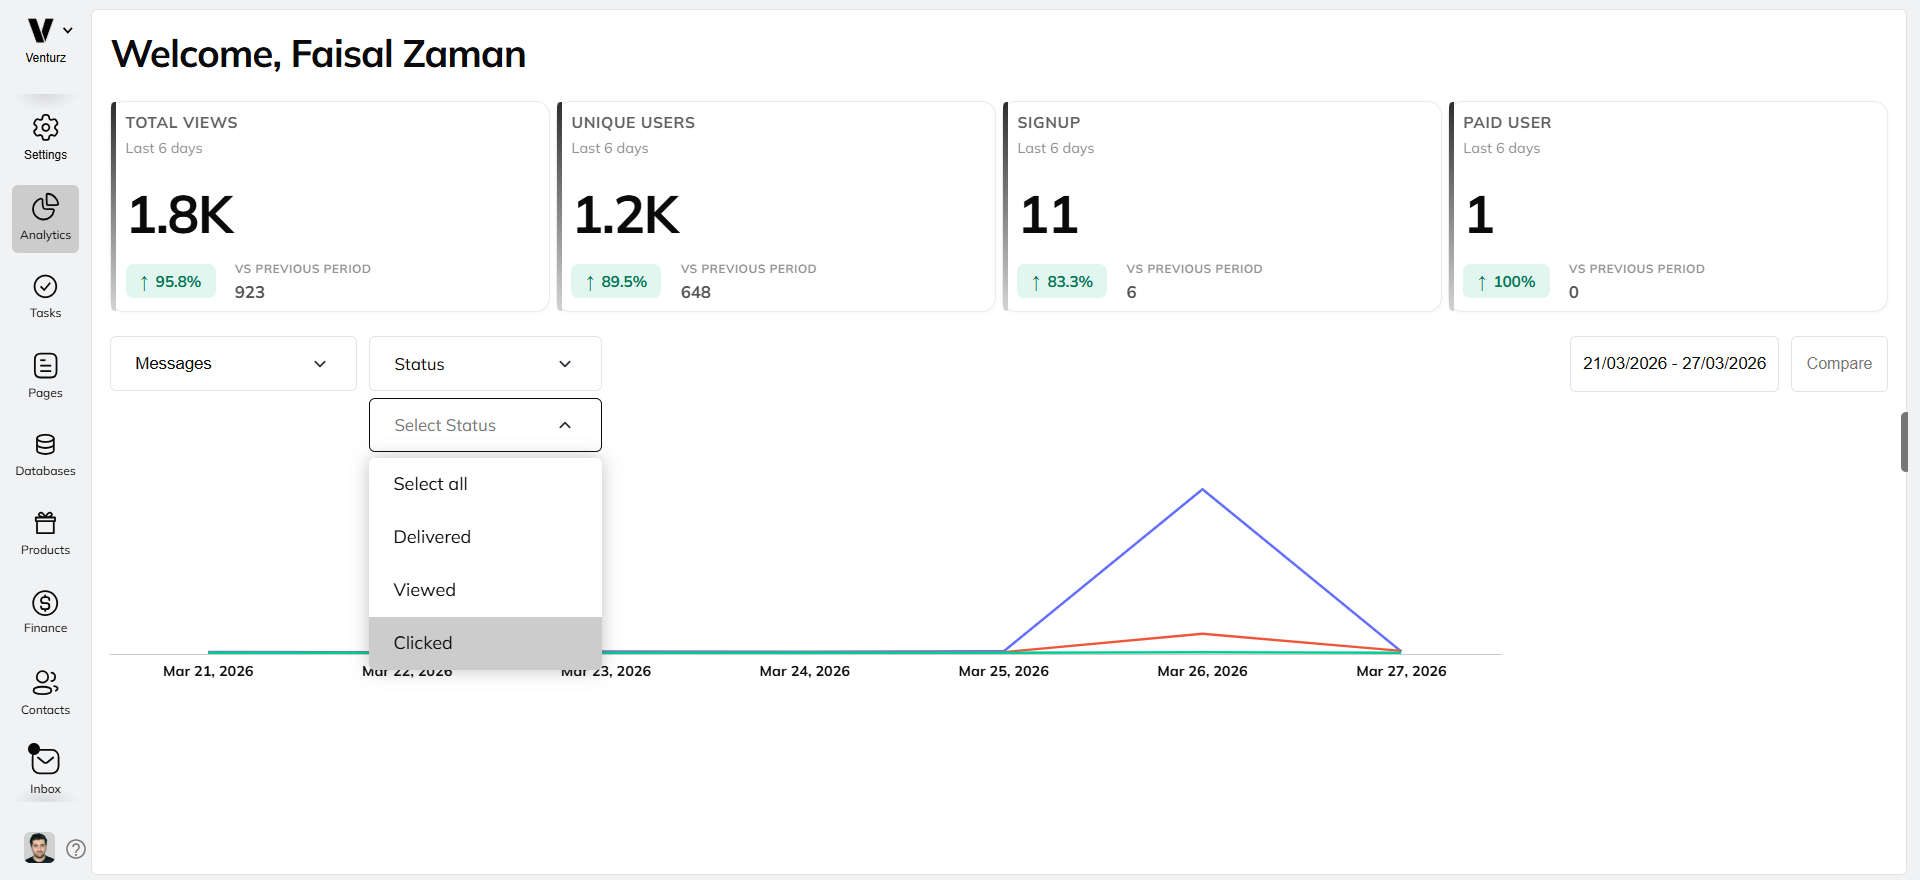
To check how your emails are performing:
Select Messages option in dropdown. Click on the Filter button. Select Status from the filter list.
In the dropdown, you’ll see options like:
- Delivered
- Viewed
- Clicked
This lets you quickly track how many users opened or engaged with each message.
With Venturz, you can monitor key sales metrics and understand how your product or service is performing. This helps you identify trends, track growth, and make better business decisions based on real data.
Venturz automatically tracks important sales-related metrics, including:
- Unique Users
- Registered Users
- Paid Users
- Startups Created
You can filter sales data to better understand specific user groups or traffic sources. Available filters include:
- Country – See where your customers are coming from
- Device Type – Desktop, mobile, or tablet users
- Browser – Browser types used by your audience
- Page URLs – Which landing or conversion pages users interacted with
- UTM Source – Track marketing campaign performance
- Referrer – Identify what pages users came from before converting
- Referrer Domain – Domains referring users to your site
- Plan Type – Filter sales by subscription plan or pricing tier
In addition to built-in sales analytics, Venturz allows you to track custom events—so you can measure actions that are specific to your product, app, or workflow.
This is especially useful for businesses with unique sales or engagement processes. Whether you're running a SaaS platform, an eCommerce store, or a community app, custom events give you the flexibility to track exactly what matters to you.
- Number of demos booked
- Sales qualified leads generated
- User-to-user interactions
- App feature usage (e.g., trial-to-paid upgrade, tool used)
- Transactions completed or refunded
- Subscription changes (upgrades, downgrades, cancellations)
- Affiliate signups or referrals
- Cart abandonments (for eCommerce)
You can track custom events in Venturz by sending them through our UserObserver—a built-in utility designed to help you emit events directly from your product or app.
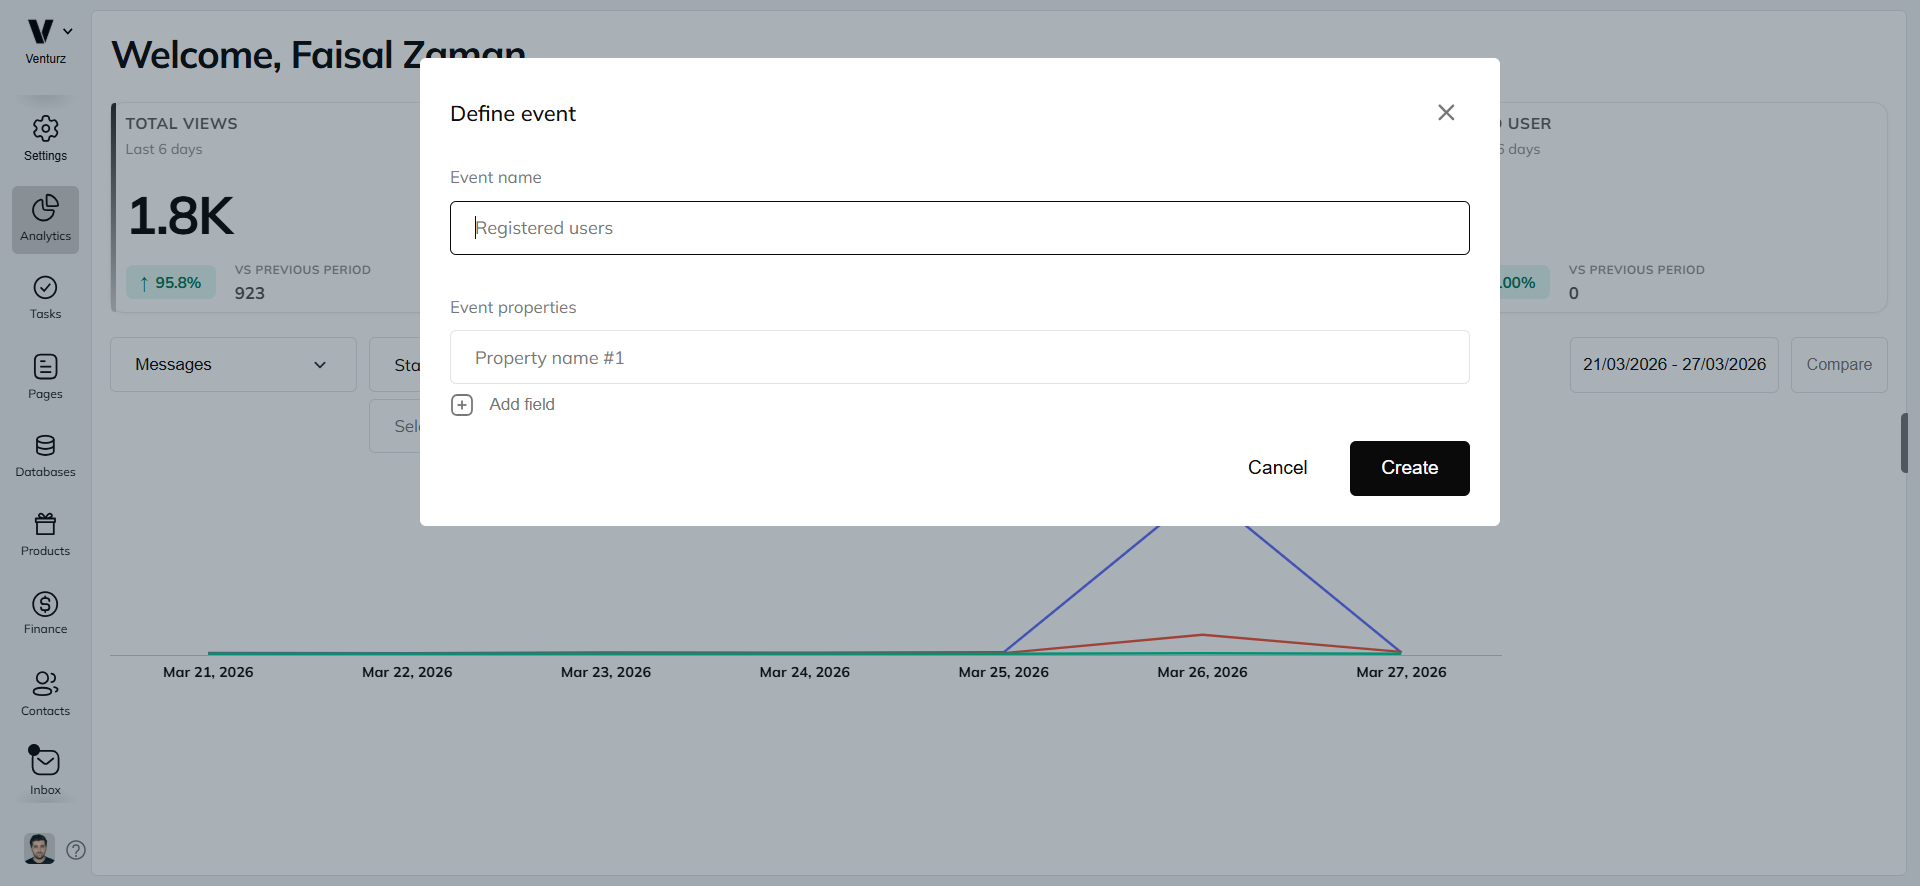
To set this up:
- First, define the event you want to track.
- Go to Settings → API Access to find your project credentials and integration details.
- Use the UserObserver in your frontend or backend to emit the event along with any required data (e.g., user ID, event name, properties).
- The event will be sent to Venturz in real time and will appear in your analytics dashboard.
For server-side integrations or external tools, you can also send events via API or webhook, giving you flexibility to track actions across different platforms.
Can't find the solution to your problem and feeling stuck?
No worries at all! We're here to help you out. You can easily reach us in two ways: either by sending an email to support@venturz.co or by clicking on the live chat 💬 button located in the right bottom corner of your screen. Don't hesitate to get in touch with any questions you might have!
Startup Events
Live Chat